From EPICSWIKI
Contents
Here’s how to install NAL using yum on RedHat Enterprise 5 x86 Linux box
Nagios default installation
Nagios application is provided by rpmforge repository, so you have to install it to configure yum properly.
See https://www.tecmint.com/enable-rpmforge-repository/ for instruction on how to achieve this.
After that, it is possible to install the Nagios application. For the “server side”, you need these following packages: 1) nagios: the main application package 2) nagios-plugins: provides all the command scripts used by users to define nagios services. In some cases there is also nagios-plugins-all (that’s better) 3) nagios-plugins-nrpe: provides the check_nrpe script used to communicate with nagios clients and run remote services
root> yum install -y nagios
root> yum install -y nagios-plugins
root> yum install -y nagios-plugins-nrpe
With that I’ve installed Nagios 3.2.3 version.
Nagios: configuration
When you install Nagios by yum, all the apache configuration are done by default.
To check the web interface you must define the password for nagiosadmin user (default nagios administrator). This passsword must be encrypted. you can use htpasswd command to set that an save in
/etc/nagios/htpasswd.users
Start the apache and nagios services
    root> service httpd start (restart)
    root> service nagios start
and check the nagios webpage at http://localhost.localdomain/nagios . If it is all correct, you have to see the authentication popup. When you are in the main page, you can monitor the localhost machine (nagios provides some information about hosts and services); all the services should be OK, but in some case you have to check some permissions/configurations.
The main configuration file is /etc/nagios/nagios.cfg
in this file you can configure every feature of nagios. We use most of the default options, the only parameters enabled are:
- enable servers directory: you can define all the servers’ cfg files into this directory (cleaner job)
cfg_dir=/etc/nagios/servers
and create the folder:
# mkdir /etc/nagios/servers
In the servers folder you have to define all the hosts you want to monitor. For a correct management, you have to define 2 different files:
- HOST.cfg: define the specifics that nagios uses to monitor the host desired. You must define one file per host!
- groups.cfg: indicate all the different groups of hosts. It is very useful to manage and monitor a large number of machines
Example:
- File servers/example.cfg:
define host{
       use                     linux-server
       host_name               example
       alias                   example display in web interface
       address                 10.6.0.1
       notification_period     24x7
       icon_image              example.jpg
       }
define service{
       use                             local-service
       host_name                       example
       service_description             PING
       check_command                   check_ping!100.0,20%!500.0,60%
       }
define service{
       use                             local-service
       host_name                       example
       service_description             SSH
       check_command                   check_ssh
       }
in this code: 1) notification_period is defined in /etc/nagios/objects/timeperiods.cfg –> you can edit this file to add/set different time periods 2) icon_image is situated in /usr/share/nagios/images/logos/. if you want to add new images you must save them in this place 3) service_description is the service name displayed in the web interface 4) check_command define the command desired and situated in /usr/lib/nagios/plugins
- File servers/groups.cfg:
define hostgroup{
       hostgroup_name  example ; The name of the hostgroup
       alias           example @ MyLab ; Long name of the group
       members         localhost, example
       }
You have to define the host_name used before in members variable.
After these changes, verify the configuration files through
# nagios -v /etc/nagios/nagios.cfg
and then, if there aren’t any error, restart the service
# service nagios restart
Nagios Default Folder Locations
By default Nagios yum installation, Nagios stores the following file location into your harddisk
   * /etc/nagios/ - Nagios configuration folder locations
   * /var/log/nagios/nagios.log - Nagios log
   * /usr/share/nagios/ - Nagios, docs, sounds, and image folder locations
   * /usr/lib/nagios/cgi/ - Nagios CGI folder location
   * /usr/bin - Nagios binaries
   * /etc/httpd/conf.d/nagios.conf - Nagios Apache folder files
Insert the EPICS Nagios Plugins
What you did in the chapters above was a generic Nagios installation/setup.
Going to here, You will find the nagios plugin to EPICS. Download the plugin and save into the
/usr/lib/nagios/plugins/
Change the permission to check_caget.sh
root> chmod +x check_caget.sh
now verify that is usable with:
> ./check_caget.sh --help
verfing using camonitor a PV, i.e. for me giacchinHost:aiExample
> camonitor giacchinHost:aiExample
Note: After the version 1.3 the plugin assume the presence of caget in /usr/bin If that is not true at your site, please fix it making a symbolic link like (i.e.): ln -s /opt/epics/base-3.14.9/bin/linux-x86/caget /usr/bin/caget
Using the EPICS environment variables you should avoid to broadcast to the network, for me the applicable values were:
    EPICS_CA_AUTO_ADDR_LIST=NO
    EPICS_CA_ADDR_LIST=127.0.0.1
therefore may I test the plugin with the follow command:
    > ./check_caget_dev_gw.sh -pv giacchinHost:aiExample -H 127.0.0.1
    > STATE_OK: giacchinHost:aiExample 5 2007-11-16 15:23:18.560231  ; te: 0 sec.
if that reply correctly the status of your PV you can continue the installation.
Now install the EPICS logos images
Download the epics.gif image available from the same place
and install that:
root> mv epics,gif /usr/share/nagios/images/logos/
Save the original Nagios setup and replace it
Go to /etc folder and save the original setup
root> tar cvf nagios.or.tar ./nagios/
download there the etc.nagios.tar available at same place
and restore the nagios folder with that:
root> tar xvf ./etc.nagios.tar
Note: Now looking around the files into /etc/nagios and adjust that to meet your network setup requirements. You will find an epicsExample.cfg which contains a pre-setted PV names, please adjust that to meet the yours.
NAGIOS check configuration file
For sanity checking, make sure you verify Nagios config files. This can be done like so
root> nagios -v /etc/nagios/nagios.cfg
The above command would show you for any erroneous lines frin Nagios config file.
HTTPD configuration
Check the presence of line: “include conf.d/*.conf”
in /etc/httpd/conf/httpd.conf
Check the paths into the file : /etc/httpd/conf.d/nagios.conf
Make a file named .htaccess into /usr/lib/nagios/cgi-bin/ and /usr/share/nagios/html/
which will contains:
   AuthName "Nagios Access"
   AuthType Basic
   AuthUserFile /etc/nagios/passwd
   require valid-user
Now create a nagios user with the following command:
root> htpasswd -c /etc/nagios/passwd nagiosadmin
SELinux setup
For the first test: set it permissive by
root> system-config-securitylevel
NAGIOS as a Linux service
Basically, at this point of basic Nagios configuration, restarting Nagios should be successful.
Reload your apache service together with your Nagios service like so
    root> service httpd restart
    root> service Nagios stop
    root> service Nagios start
    root> service Nagios status
Open your favorite web-browser on http://localhost/nagios/
login like “nagiosadmin”, give your password and enjoy!
NB. If you are using my etc.nagios.tar the passwd to login is “nagiosadmin”
See my nagios screen shots in action:
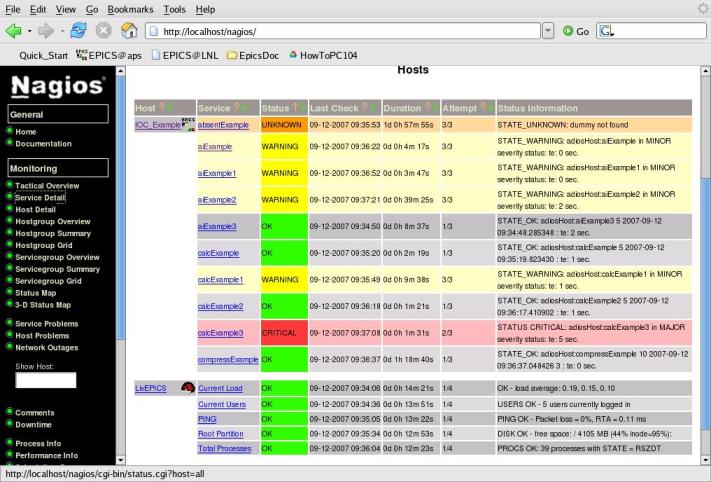
Nagios Service Details

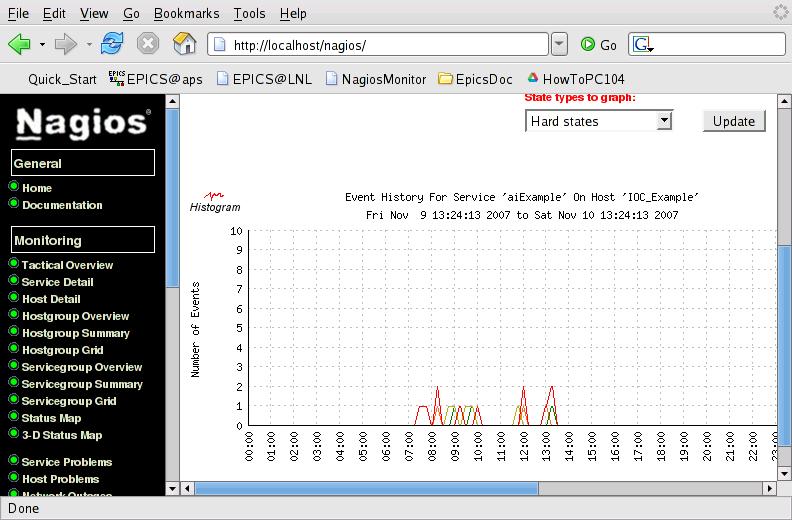
Nagios Alert Histogram

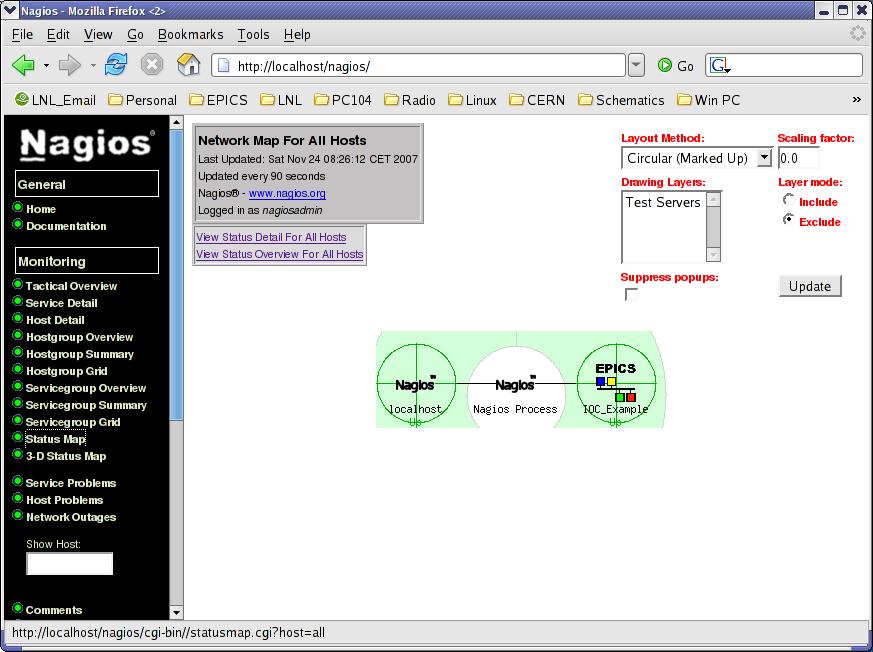
Nagios Status Map

Conclusions
There are a lot of other interesting feature that comes from free using NAGIOS, looking around you should find a lot yourself. There is a cool Firefox plugin https://exchange.nagios.org/directory/Addons/Frontends-%28GUIs-and-CLIs%29/Web-Interfaces/nagioschecker–2D-Firefox-Addon/details which give you the possibility to continuous monitoring the PVs during the regular usage of the browser.
At this time Ralph Lange has realized a test to NAL at Bessy. A great acknowledgments to him, he has supported me since the idea of use Nagios born in my mind. Acknowledgments to Maurizio Montis, who made a kickstart script to deploy a RHEL5 box equipped with Nagios ready to use, and, adjust and fix the old notes on FC7 to the new OS: RHEL5.
More information about NAL could be found here. A special LivEPICS version (Linux Live CD EPICS fully equipped) with NAGIOS pre-setted and ready to use here .
Thank you for your attention! Please, give me a your feedback, and fell free to drop me an email, I’ll be happy to continue to work on this idea if someone is interested to use it.
—MauroGiacchini 15.54, 2 Dec 2011
The Plugin Script
/usr/lib/nagios/plugins/check_caget_dev_gw.sh script for Nagios
#!/bin/sh
#
#####################################################################################
#####################################################################################
##                           Nagios plugin to check EPICS PV Status                ##
#####################################################################################
#####################################################################################
#
# Script to retrieve EPICS PV Name status using the "caget" command.
# Written by Mauro Giacchini (mauro.giacchini@lnl.infn.it)
# Last Modified: 17-11-2007
#
# Usage: ./check_caget.sh -pv <PV name>
#
# Description:
#   	This script uses caget command to retrieve the PV status.
#
# Limitations:
# 	This script has been tested on Linux Fedora Core 6.
#
# Output:
# 	The output contains the "te" time elapsed calculated like a difference from PV's
# timestamp and the linux "date" command (suggestion: use ntp common server
# to IOCs and Nagios server box). The STATUS of the service (..of the PV)
# follow the severity rules:
#
# Severity (none) >>>> STATE_OK		# OK = green
#
# Severity MINOR  >>>> STATE_WARNING	# WARNING = yellow
#
# Severity MAJOR  >>>> STATE_CRITICAL	# CRITICAL = red
#
# PV not found    >>>> STATE_UNKNOWN	# UNKNOWNN = orange
#
# In case of Severity (none) it show the stdout of "caget -a" with appended the "te".
#
# Other notes:
#  Firefox Plugin : A FireFox extension is avilable to monitor Nagios server.
#  https://exchange.nagios.org/directory/Addons/Frontends-%28GUIs-and-CLIs%29/Web-Interfaces/nagioschecker--2D-Firefox-Addon/details
#
# Nagios configuration setup:
# 	You need to add the command to commands.cfg
#
# define command{
# 	command_name	check_caget
# 	command_line	$USER1$/check_caget.sh -pv $ARG1$
# 	}
#
#	And, you need to add the service to services.cfg
#
# define service{
#        use         		generic-service	;
#        host_name		IOC_Example	;
#        service_description   	aiExample	;
#        is_volatile           	0		;
#        check_period		24x7		;
#        max_check_attempts    	3		;
#        normal_check_interval 	3		;
#        retry_check_interval  	1		;
#        contact_groups        	admins		;
#        notification_interval 	120		;
#        notification_period   	24x7		;
#        notification_options  	w,u,c,r		;
#        check_command         	check_caget!rootHost:aiExample	;
#        }
#
# then place this script in the /usr/lib/nagios/plugins/ on the Nagios box server.
# Don't forget to set the right execution permission to this file.
#
# Threshold and ranges: please, have a look at:
# http://nagios-plugins.org/doc/guidelines.html#THRESHOLDFORMAT
#
# Last: This script still needs debugging and fixups (exercise for reader) :-)
#
#####################################################################################
# DEBUGGING OPTION
# This option determines whether or not debugging messages are showed
# Values: 0=debugging off, 1=debugging on

DEBUG="0"


#####################################################################################
# CAGET LOCATION
# This option determines where the caget executable is located.
# The default /usr/bin/caget should be made with a symbolic link
# made by root (i.e.): ln -s /opt/epics/base-3.14.9/bin/linux-x86/caget /usr/bin/caget


CAGET_LOCATION=/usr/bin/caget


#####################################################################################
# Script exit status

STATE_OK=0		# OK = green

STATE_WARNING=1		# WARNING = yellow

STATE_CRITICAL=2	# CRITICAL = red

STATE_UNKNOWN=3  	# UNKNOWNN = orange

VERSION="v1.3"

#####################################################################################
# print_revision() function

print_revision (){

    echo "Check_caget (nagios-plugins 1.4 to nagios 2.9) (EPICS base 3.14.9) $VERSION"
}

#####################################################################################
# print_usage() function

print_usage() {

    	echo ""
    	echo "Usage: check_caget_dev_gw -pv <PV name> "
    	echo "Usage: check_caget_dev_gw -pv <PV name> -H <EPICS_CA_ADDR_LIST>"
    	echo "Usage: check_caget_dev_gw -pv <PV name> -p <EPICS_CA_SERVER_PORT>"
    	echo "Usage: check_caget_dev_gw -pv <PV name> -expval <EXPECTED VALUE>"
    	echo "Usage: check_caget_dev_gw [-h] [--help]"
    	echo "Usage: check_caget_dev_gw [-V]"
    	echo ""
}

#####################################################################################
# print_help() function

print_help() {
	echo ""
	print_usage
	echo ""
	echo "Script to retrieve the PV status for EPICS control systems."
	echo ""
	echo "This plugin not developped by the Nagios Plugin group."
	echo "Please do not e-mail them for support on this plugin, since"
	echo "they won't know what you're talking about :P"
	echo ""
	echo "For contact info: mauro.giacchini@lnl.infn.it"
	echo "Download : https://web.infn.it/epics/index.php/resources"
	echo ""
}

#####################################################################################
# Check the caget presence.


verify_caget_presence() {


if ! type $CAGET_LOCATION >/dev/null 2>&1; then

	echo "STATUS CRITICAL: caget not found (Did you set up the rigth one Nagios USERn? _or_ caget not found!)"
	exit $STATE_CRITICAL
fi
}


#####################################################################################
# Control caget plugin input parameters

EXPVAL=""
EPICS_CA_ADDR_LIST="" 	# Default YES
EPICS_CA_SERVER_PORT="" # Default 5064 _and_  	value > 5000
EPICS_CA_SERVER_PORT_MIN="5000"

while test -n "$1"; do

    case "$1" in

	--help)
	print_help
	exit $STATE_OK
	;;

	-h)
	print_help
	exit $STATE_OK
	;;

	-V)
	print_revision
	exit $STATE_OK
	;;

	-pv)
	PVNAME=$2
	shift
	;;

	-expval)
	EXPVAL=$2
	if [ -z $EXPVAL ]; then
  	  	echo "STATUS CRITICAL: Expected value absent"
   	 	exit $STATE_CRITICAL
	fi
	shift
	;;

	-H)
	EPICS_CA_ADDR_LIST=$2
	if [ -z $EPICS_CA_ADDR_LIST ]; then
  	  	echo "STATUS CRITICAL: Expected EPICS_CA_ADDR_LIST absent"
   	 	exit $STATE_CRITICAL
	fi
	export EPICS_CA_ADDR_LIST
	EPICS_CA_AUTO_ADDR_LIST="NO"
	export EPICS_CA_AUTO_ADDR_LIST
	shift
	;;

	-p)
	EPICS_CA_SERVER_PORT=$2
	if [ -z $EPICS_CA_SERVER_PORT ]; then
  	  	echo "STATUS CRITICAL: Expected EPICS_CA_SERVER_PORT absent"
   	 	exit $STATE_CRITICAL
	fi
	if [ $EPICS_CA_SERVER_PORT -le $EPICS_CA_SERVER_PORT_MIN ]; then
  	  	echo "STATUS CRITICAL: Expected EPICS_CA_SERVER_PORT minor than allowed (5001)"
   	 	exit $STATE_CRITICAL
	fi
	export EPICS_CA_SERVER_PORT
	shift
	;;

	*)
	echo ""
	echo "Unknow argument: $1"
	print_usage
	exit $STATE_UNKNOWN
	;;

esac
shift
done


verify_caget_presence

if [ -z $PVNAME ]; then

    echo "STATUS CRITICAL: PV Name not specified"
    exit $STATE_CRITICAL
fi

#####################################################################################
# FINALLY... RETRIEVING THE VALUES (caget)


#CAGET_REPLY=`caget -a $PVNAME`
CAGET_REPLY=`$CAGET_LOCATION -a $PVNAME`

IFS=" "
read pvname date time value status severity<<END
$CAGET_REPLY
END

if [ -z $pvname ]; then

    echo "STATE_UNKNOWN: $PVNAME not found"
    exit $STATE_UNKNOWN
 fi

#####################################################################################
# Calculus difference between the PV timestamp and the actual time

	SPACE=" "
	dte1=$(date --date "$date$SPACE$time" +%s)
    	dte2=$(date +%s)
    	diffSec=$((dte2-dte1))
    	if ((diffSec < 0)); then abs=-1; else abs=1; fi
	te=$((diffSec/abs))
#    	echo "Time elapsed (sec.): $te"

#####################################################################################
# Output the NAGIOS status using an expected value

if [ $EXPVAL ]; then

		if  [[ $value -eq $EXPVAL ]] ;
			then echo "STATE_OK: Expected value ($EXPVAL) to $pvname match; te: $te sec."
			exit $STATE_OK;
			else  echo "STATUS CRITICAL: Expected value ($EXPVAL) to $pvname didn't match"
			exit $STATE_CRITICAL;
		fi
fi

#####################################################################################
# Output the NAGIOS status using the Severity field
case $severity in

	MAJOR)
    	echo "STATUS CRITICAL: $pvname in MAJOR severity status; te: $te sec."
    	exit $STATE_CRITICAL
	;;

	MINOR)
    	echo "STATE_WARNING: $pvname in MINOR severity status; te: $te sec."
    	exit $STATE_WARNING
	;;

	*)
	echo "STATE_OK: $pvname $value $date $time $status ; te: $te sec."
    	exit $STATE_OK
	;;
esac